Digital history has shaped spatial and data visualization in exciting new ways. According to Richard White, “Visualization and spatial history are not about producing illustrations or maps to communicate things that you have discovered by other means. It is a means of doing research; it generates questions that might otherwise go unasked, it reveals historical relations that might otherwise go unnoticed, and it undermines, or substantiates, stories upon which we build our own versions of the past.” Franco Moretti concurs, “If it can be done with words, then maps are superfluous.” Therefore, digital history not only provides additional means to communicate information, it also generates new questions and methods of inquiry. Digital historians have employed big data to uncover larger picture phenomenon and relationships. According to Giacomo Parrinello, creating a database “helps me to avoid the risk of overemphasizing the single episode, and to gain a clearer perspective of its relative importance and historical interconnections.” As John Bonnett notes, when content are presented in multiple formats consumers develop deeper meaning and understanding, and digital history provides this. In this post I will outline how digital history has shaped both geospatial analysis and data visualization. I will then discuss their potential use in the context of my place history project.
Geospatial analysis
According to John Gaddis, “Time and space are infinitely divisible.” Geospatial analysis allows digital historians to find new ways in which to compress and expand time and space. Furthermore, “If time and space provide the field in which history happens, then, structure and process provide the mechanism” (Gaddis, 35). Maps allow digital historians to trace these processes and structures in new and exciting ways. In effect, “new data analytics seek to gain insights ‘born from the data’” (Kitchin, 2).
Data Visualization
According to Bonnett, the human sciences are currently “undergoing what can be characterized as a Topographic Revolution in computer-mediated communication” (177). These new forms of communication allow digital historians to present their work in varying modes. Open access to big data may be used to produce data visualizations that analyze the micro or demonstrate the macro. According to Graham, Milligan and Weingart, “textual analysis and basic visualizations need to be part of our toolkit.”
Potential Indicators of Red Scare Activism
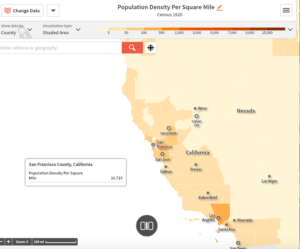
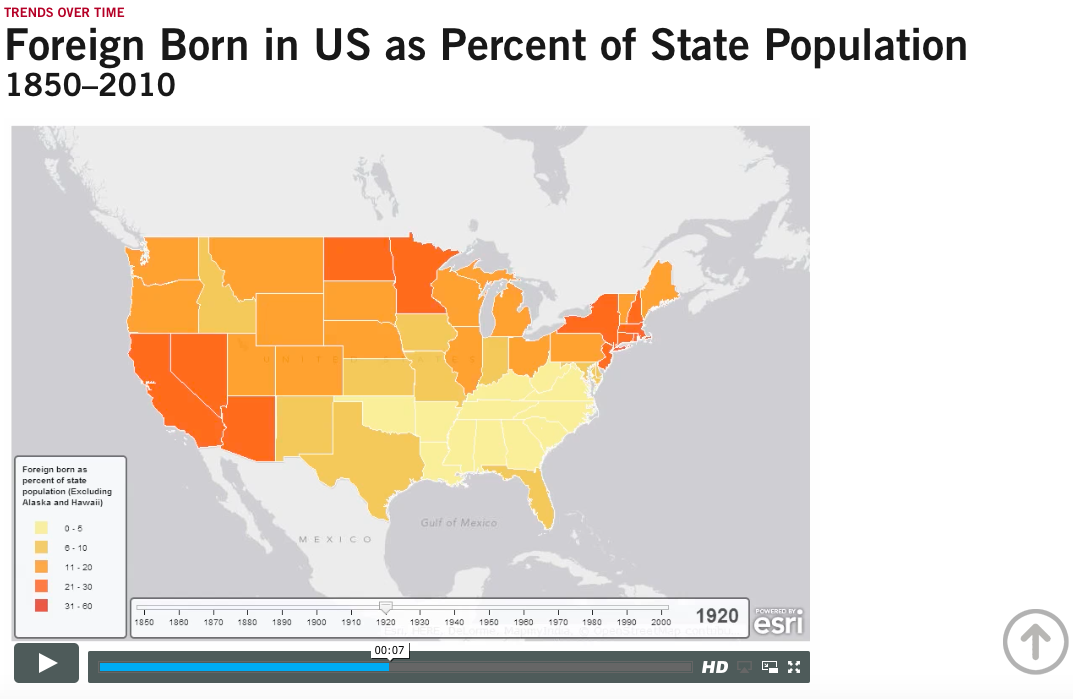
Using geospatial analysis and data visualization, I could potentially map over time and compare the geographic hubs of Red Scare activity. For example the population density in California was the highest in San Francisco in 1919-1920. Similarly New York experienced high population density at this time. The populations in California and New York also have historically high foreign-born populations.
Focusing specifically on activities in San Francisco I will utilize digital visualization and geospatial analytics to trace labor unionization, communist and socialist organizing, acts of terror, and the Palmer Raids. I’d also like to employ data visualization to demonstrate the gender proportions of people who were arrested during the Palmer Raids, and the 249 “undesirables” who were deported to Russia aboard the Red Ark (Buford), including Emma Goldman and Ethel Bernstein.
Works Cited
Bonnett, John. “Charting a New Aesthetics for History: 3D, Scenarios, and the Future of the Historian’s Craft.” Social History, May 2007.
ESRI “Trends Over Time”: http://www.hbs.edu/businesshistory/teaching/resources/Pages/historical-data-visualization-details.aspx?data_id=43
Gaddis, John. The Landscape of History: How Historians Map the Past. Oxford: Oxford University Press, 2002.
Graham, Milligan, and Weingart, The Historian’s Macroscope, “Delving into Big Data.”
Kitchin, Rob. “Big Data, New Epistemologies and Paradigm Shifts,” Big Data & Society (2014) 1-12
Moretti, Franco. “Maps” in Graphs, Maps, and Trees. New York: Verso, 2005.
Parrinello, Giacomo. “Knowledge Gains and Geeky Pleasures.”
“RED FLAGGERS HAVE QUARTERS IN FRISCO.” Arizona Republican (1890-1922), Nov 29, 1918, http://login.ezproxy1.lib.asu.edu/login?url=http://search.proquest.com/docview/814863613?accountid=4485 (accessed November 19, 2016).
White, Richard. “What is Spatial History?”